GOLD AND SILVER ENTERING EXPONENTIAL PHASE
The desire of gold is not for gold. It is for the means of freedom and benefit.
Ralph Waldo Emerson
Gold is now in a hurry and silver even more so.
The price moves in the coming months and year are likely to be spectacular. The combination of technical and fundamental factors can easily drive gold well above $3,000 and silver to new highs above $50.
Forecasting gold is a mug’s game, as I have often stated.
But that is in the short term.
In the medium to long term, forecasting the Gold price is a cinch.
How can I be so certain?
Well, since the history of gold and money began, gold has always increased in value measured against fiat money.
Voltaire gave us the formula in 1729 when he said:
PAPER MONEY EVENTUALLY RETURNS TO ITS INTRINSIC VALUE – ZERO
So why has no investor or layman ever heeded the simple fact that –
ALL CURRENCIES HAVE WITHOUT FAIL GONE TO ZERO.
What most people, including experienced investors, don’t understand is that gold doesn’t increase in value.
Gold just maintains stable purchasing power. A Roman toga 2000 years ago cost 1 ounce of gold and a tailored suit today also costs 1 ounce of gold.
So it is really totally wrong to talk about gold going up when it is the unit we measure gold in that goes down. Just as all fiat money has done.
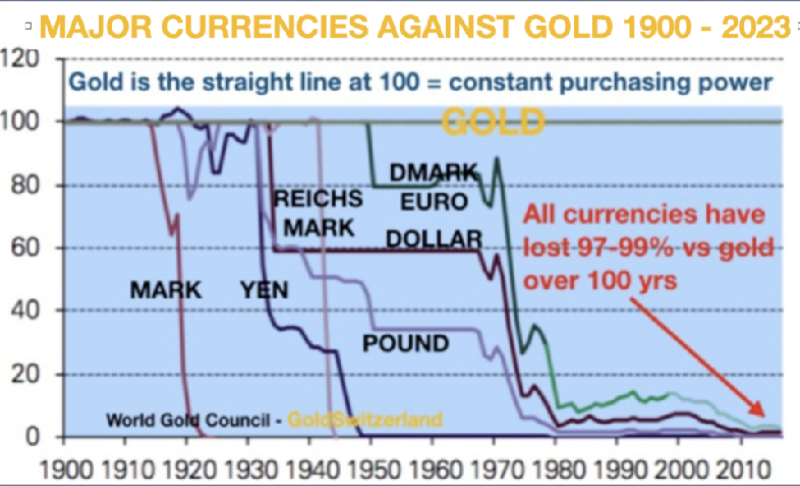
Just take gold measured in US dollars. As the illustration below shows, the value of the dollar since 1971 has crashed, measured in real terms which is gold.
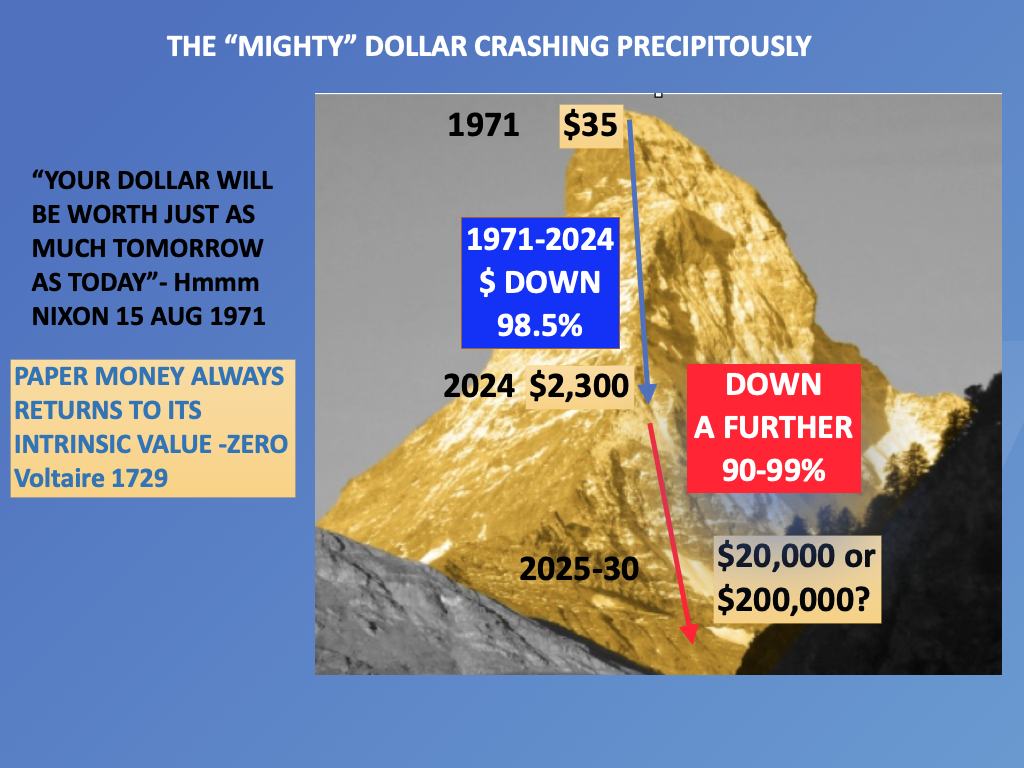
As the picture shows, 1 ounce of gold cost $35 in 1971. Today 53 years later 1 ounce of gold costs $2,300. So has gold increased in value 66x since 1971?
No of course not, it is the dollar which has declined in value and purchasing power by 98.5% since 1971.
So what will gold be worth in the next 5 years? That is of course the wrong question.
Instead we must ask how much will the dollar and all currencies decline in real terms in the next few years?
Gold and silver have not increased in line with money supply or inflation and are severely undervalued.
Just look at gold adjusted for US CPI (Consumer Price Index) in the graph below.
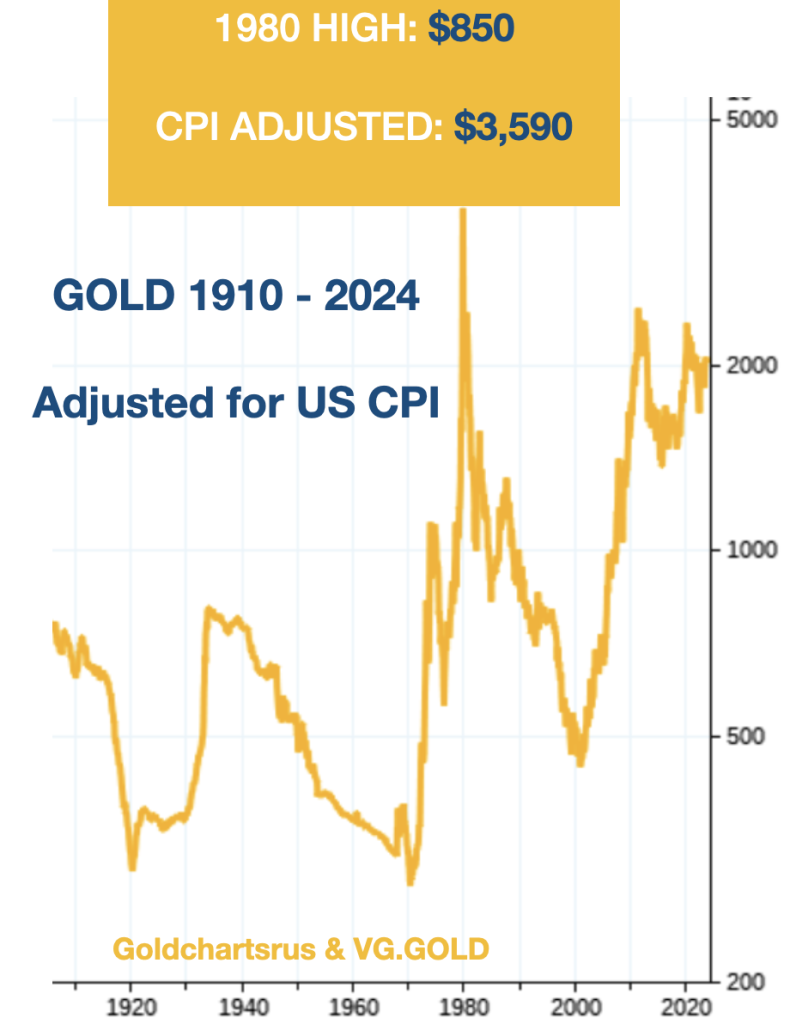
So if we inflation adjust the gold price, the 1980 high at $850 would today be $3,590.
But if we adjust the gold price for REAL inflation based on Shadow Government Statistics calculation, the gold price equivalent of the $850 high would today be $29,200.
In the 1980s the inflation calculation was adjusted, by the US government, to artificially improve/reduce official inflation figures.
And if we adjust the silver price for US CPI, the 1980 silver high of $50 would today be $166.
Adjusted for REAL inflation, the $50 high silver in 1980 would today be $1,350.
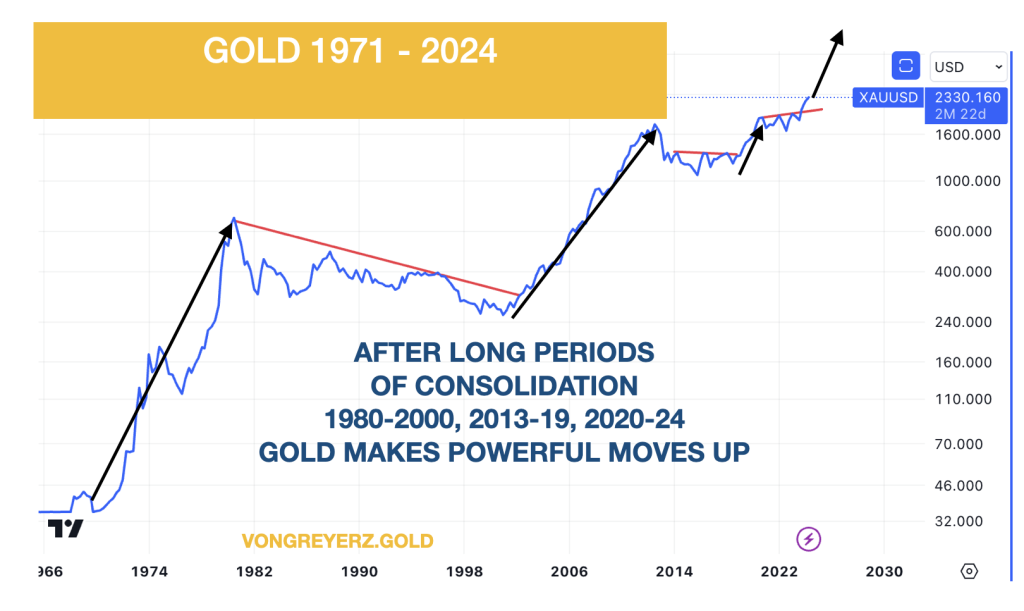
GOLD – LONG SIDEWAYS MOVES FOLLOWED BY EXPLOSIONS
Gold makes powerful moves and then goes sideways for long periods. After the gold explosion from $35 in 1971 to $850 in 1980, gold spent 20 years correcting until 2000.
That was the time that we decided that gold was now ready for the next run at the same time as risk in stock markets, debt and derivatives was starting to look dangerous.
So in 2002 we made major investments into physical gold at $300 for investors and for ourselves. At the time I recommended up to 50% of financial assets into gold based on wealth preservation principles and also the fact that gold at the time was unloved and oversold and thus represented excellent value.
WE HAVE LIFTOFF!
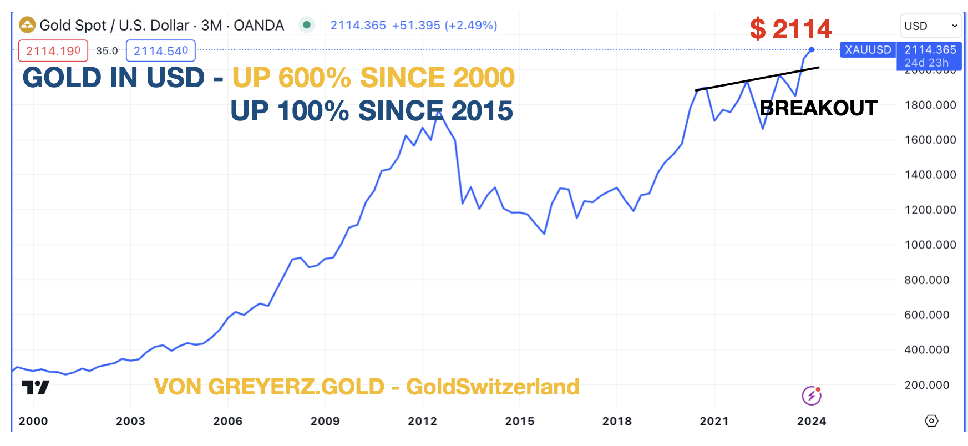
As gold went through $2,100 in early March, I declared “GOLD – WE HAVE LIFTOFF!”
Since then gold has moved up another $200 but that is the mere beginning of a secular move.
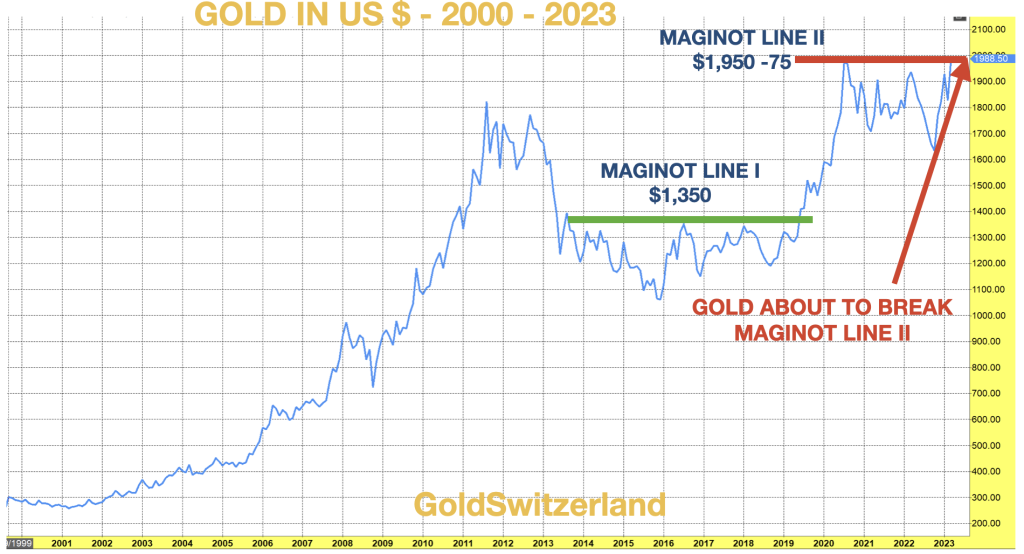
After the move from $300 in 2002 to $1920 in 2011 gold had a long correction again between 2013 and 2016. The break of the first Maginot Line (see chart) was predictable (article Feb 2019). Then in March 2023 it was clear that the second Maginot Line would break and we were seeing the beginning of the demise of the financial system as four US banks and Credit Suisse collapsed within a mater of days.
I discussed this in my March 2023 article “THIS IS IT! THE FINANCIAL SYSTEM IS TERMINALLY BROKEN”
HOLDING GOLD REQUIRES PATIENCE
The message I want to convey with the two graphs above is that gold investing requires patience and obviously timing of the entry points. But in the long term investors will be extravagantly rewarded and at the same time hold the best insurance against a rotten system that money can buy.
Gold has consolidated under $2,000 since August 2020. The recent breakout is extremely important and not the end of a move.
No, this is the beginning of a move that will reach heights that today are unfathomable.
I am in no way intending to be sensational, but just trying to explain that fundamental and technical factors are now pointing to a secular bull market in gold and silver.
Also, normal measures of overbuying will not be valid. Gold and silver will in the coming months be overbought for long periods of time.
But don’t forget that there will also be vicious corrections, especially in silver which is not for widows and orphans.
I want to emphasise again that our intention to invest heavily in gold and much less heavily in silver (much more volatile), was primarily for long term wealth preservation reasons. That reason is more valid than ever today.
THE EVERYTHING COLLAPSE WILL COME
Since we have been expecting the “Everything Bubble” to turn into the “Everything Collapse” (see my article April 2023), all the bubble assets like stocks, bonds and property are likely to decline substantially in real terms which means measured in gold.
I willingly admit that I have been premature in predicting the Everything Bubble to collapse in nominal terms. But in real terms almost all major asset classes have underperformed compared to gold since 2000 including stocks.
It is only the illusion of growth and prosperity based on worthless money creation that keeps this circus travelling on. But the circus acts will soon run out of tricks as the world discovers that this is only a mirage which has totally deluded us.
If we take stocks as an example, gold has outperformed the Dow and S&P since 2000.
Here is what I wrote 2 weeks ago:
The world’s best kept investment secret is GOLD.
- Gold has gone up 7.5X this century
- Gold Compound annual return since 2000 is 9.2%
- Dow Jones Compound annual return since 2000 is 7.7% incl. reinvested dividends
- So why are only 0.6% of global financial assets in gold?
- The simple answer is that most investors don’t understand gold because governments suppress the virtues of gold.
See my article on this subject
Stocks are now in position where we could have a major decline/collapse at any time.
WOLVES IN SHEEP’S CLOTHING

So back to the circus. The leaders of the Western World, whether we take the US, UK, Canada, Germany, France etc are mere clowns trying to fool their people with fake costumes (wolf in sheep’s clothing) and fake acts whether it is:
Money printing, debts, vaccines, climate, war, migration, more lies, propaganda, moral and ethical decadence to mention but a few of the problems that are leading us to the collapse of the Western World.
Real clowns would probably do a better job than current leaders. They would at least entertain us instead of bringing the misery that a majority of people are currently experiencing.
Yes, I am aware that there is a small elite that is benefiting dramatically from the shameful mismanagement of the world economy whilst the majority suffers badly from inept leadership around the world.
So how will this end? In my view, as I have outlined in many articles, it can only end one way which is a total collapse of the financial system as well as of the political system.
Will we first have hyperinflation and then a deflationary implosion or will it go straight to the implosion. Will there be a global war. Well, the US and most Western leaders are doing their utmost to start a World War against the will of the people. There is absolutely no attempt to find a peaceful solution.
Instead it is more weapons and more money to escalate the war as well as pushing as many countries as possible into NATO. Both Biden and Stoltenberg (NATO leader) also want Ukraine – a warring nation – to join NATO.
And with today’s sophisticated and dangerous weapons, no one can win a war.
Obviously, China, Russia, North Korea and Iran would win a war with boots on the ground at a cost of 100s of millions of lives. But modern wars are won in the air. And with around 15,000 nuclear warheads, the world can be destroyed many times over in a few minutes.
The world has never had a global economic and political crisis of this magnitude with so many destructive weapons, both financial (debt, derivatives) and military.
So to forecast the outcome is clearly impossible. One can only hope that people power will prevail and that incompetent leaders will be pushed out.
Otherwise there is little us ordinary people can do.
Wealth preservation in the form of physical gold, owned directly and in a safe jurisdiction (countries like the US, Canada or EU are not safe politically) is clearly the best insurance investors can buy.
Also we must assist family and friends in the difficult times ahead and make that circle the kernel of our lives (if it isn’t already).
And remember that most of the wonderful things in life are free like nature, music, books etc.
GOLD AND SILVER ENTERING EXPONENTIAL PHASE
In recent weeks, gold has reached new all-time highs in many currencies, including the US dollar, the euro and the Swiss franc. We want to take the euphoric mood among gold investors as an opportunity to focus on a fundamental topic. From our point of view, the gold sector is riddled with an elementary misunderstanding. Many gold investors and analysts operate on an erroneous assumption: they attach too much importance to annual production and annual demand. We often read that the gold price cannot drop below production costs. We would like to discuss this misconception in the following.
Every gramme of gold that is held for a variety of reasons is for sale at a certain price. Many owners would sell at a price slightly above spot, others would only sell at a substantially higher price. If, due to favorable prices, a private individual wants to sell his gold holdings that he acquired decades ago, it will not reduce the overall supply of gold. All that happens is the transfer from one private portfolio to another private portfolio. To the buyer, it makes no difference whether the gold was produced three weeks or three millennia ago.
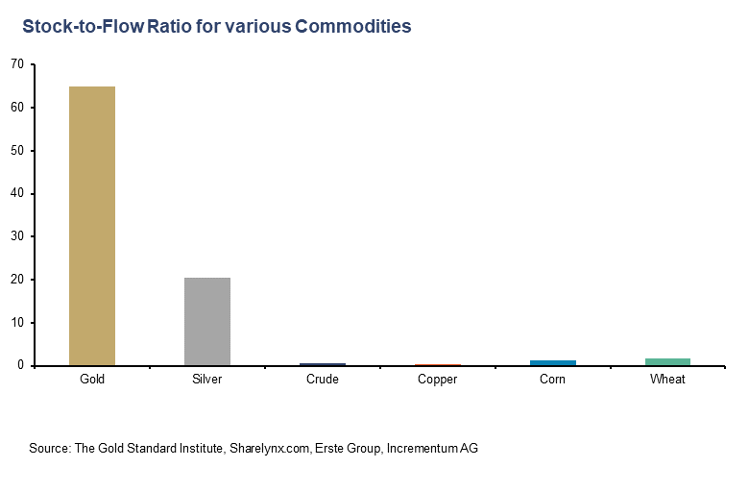
This means the annual gold production of currently more than 3,600 tons is of relatively little significance to the pricing process. Rather, the supply side consists of all the gold that has ever been produced. The recycling of existing gold accounts for a much larger share of supply than is the case for other commodities. Paradoxically, gold is not in short supply– the opposite is the case: it is one of the most widely dispersed goods in the world. Given that its industrial use is limited, the majority of all gold ever produced is still available.
In contrast to other commodities such as oil, copper or agricultural products, there is an enormous discrepancy between annual production (= flow) and the total available stock of gold. In other words, gold has a high stock-to-flow ratio (SFR). The high stock-to-flow ratio is the most important characteristic of gold (and silver). The total gold ever mined amounts to almost 213,000 tons. Annual production in 2023 was just over 3,650 tons. Dividing the two amounts gives a stock-to-flow ratio of 58.4, which means that the current annual production must be maintained for more than 58 years to double the current gold stock.
| Total reserves in tons (stock) | % share of total reserves (stock) | |
| Jewelry | 96,500 | 45% |
| Private holdings (bars, coins, ETF) | 47,500 | 22% |
| Central bank holdings | 36,.700 | 17% |
| Others | 32,000 | 15% |
| Total | 212,600 | 100% |
| Estimated mining production (flow) | 3,600 | 1.7% of total stock |
Gold holdings are currently growing by around 1.7% a year, which is much slower than all monetary aggregates around the world. This growth is roughly in line with population growth. Confidence in the current and future purchasing power of money depends largely on how much money is currently available and how the quantity will change in the future.
Gold Stock (Above Ground Gold), in Tonnes, Money Supply (US M2), in USD bn, 1910-2023
| Year | Gold Stock | yoy | Money Supply | yoy | Year | Gold Stock | yoy | Money Supply | yoy |
| 1910 | 35,626 | 2.0% | 1970 | 90,695 | 1.7% | 626.5 | 6.6% | ||
| 1911 | 36,325 | 2.0% | 1971 | 92,145 | 1.6% | 710.3 | 13.4% | ||
| 1912 | 37,030 | 1.9% | 1972 | 93,535 | 1.5% | 802.3 | 13.0% | ||
| 1913 | 37,724 | 1.9% | 1973 | 94,885 | 1.4% | 855.5 | 6.6% | ||
| 1914 | 38,387 | 1.8% | 26.0 | 1974 | 96,135 | 1.3% | 902.1 | 5.4% | |
| 1915 | 39,091 | 1.8% | 30.0 | 15.4% | 1975 | 97,335 | 1.2% | 1,016.2 | 12.6% |
| 1916 | 39,776 | 1.8% | 34.9 | 16.3% | 1976 | 98,545 | 1.2% | 1,152.0 | 13.4% |
| 1917 | 40,407 | 1.6% | 40.9 | 17.1% | 1977 | 99,755 | 1.2% | 1,270.3 | 10.3% |
| 1918 | 40,985 | 1.4% | 46.2 | 12.9% | 1978 | 100,965 | 1.2% | 1,366.0 | 7.5% |
| 1919 | 41,535 | 1.3% | 52.0 | 12.7% | 1979 | 102,175 | 1.2% | 1,473.7 | 7.9% |
| 1920 | 42,042 | 1.2% | 51.3 | -1.4% | 1980 | 103,395 | 1.2% | 1,599.8 | 8.6% |
| 1921 | 42,540 | 1.2% | 45.7 | -10.9% | 1981 | 104,675 | 1.2% | 1,755.5 | 9.7% |
| 1922 | 43,021 | 1.1% | 50.5 | 10.5% | 1982 | 106,015 | 1.3% | 1,905.9 | 8.6% |
| 1923 | 43,575 | 1.3% | 50.7 | 0.4% | 1983 | 107,415 | 1.3% | 2,123.5 | 11.4% |
| 1924 | 44,167 | 1.4% | 53.9 | 6.3% | 1984 | 108,875 | 1.4% | 2,306.4 | 8.6% |
| 1925 | 44,758 | 1.3% | 57.6 | 6.9% | 1985 | 110,405 | 1.4% | 2,492.1 | 8.1% |
| 1926 | 45,360 | 1.3% | 56.1 | -2.5% | 1986 | 112,015 | 1.5% | 2,728.0 | 9.5% |
| 1927 | 45,957 | 1.3% | 56.7 | 1.1% | 1987 | 113,675 | 1.5% | 2,826.4 | 3.6% |
| 1928 | 46,560 | 1.3% | 58.2 | 2.6% | 1988 | 115,545 | 1.6% | 2,988.2 | 5.7% |
| 1929 | 47,169 | 1.3% | 57.7 | -0.9% | 1989 | 117,555 | 1.7% | 3,152.5 | 5.5% |
| 1930 | 47,817 | 1.4% | 54.3 | -5.8% | 1990 | 119,735 | 1.9% | 3,271.8 | 3.8% |
| 1931 | 48,512 | 1.5% | 47.7 | -12.3% | 1991 | 121,895 | 1.8% | 3,372.2 | 3.1% |
| 1932 | 49,266 | 1.6% | 44.3 | -7.1% | 1992 | 124,155 | 1.9% | 3,424.7 | 1.6% |
| 1933 | 50,059 | 1.6% | 42.9 | -3.1% | 1993 | 126,435 | 1.8% | 3,474.5 | 1.5% |
| 1934 | 50,900 | 1.7% | 49.4 | 15.0% | 1994 | 128,695 | 1.8% | 3,486.4 | 0.3% |
| 1935 | 51,824 | 1.8% | 58.4 | 18.3% | 1995 | 130,925 | 1.7% | 3,629.5 | 4.1% |
| 1936 | 52,854 | 2.0% | 66.6 | 14.0% | 1996 | 133,215 | 1.7% | 3,818.6 | 5.2% |
| 1937 | 53,954 | 2.1% | 62.7 | -5.8% | 1997 | 135,665 | 1.8% | 4,032.9 | 5.6% |
| 1938 | 55,124 | 2.2% | 68.4 | 9.0% | 1998 | 138,165 | 1.8% | 4,375.2 | 8.5% |
| 1939 | 56,354 | 2.2% | 77.5 | 13.3% | 1999 | 140,735 | 1.9% | 4,638.0 | 6.0% |
| 1940 | 57,664 | 2.3% | 90.1 | 16.3% | 2000 | 143,325 | 1.8% | 4,925.0 | 6.2% |
| 1941 | 58,744 | 1.9% | 103.4 | 14.7% | 2001 | 145,925 | 1.8% | 5,433.8 | 10.3% |
| 1942 | 59,864 | 1.9% | 133.9 | 29.6% | 2002 | 148,475 | 1.7% | 5,772.0 | 6.2% |
| 1943 | 60,760 | 1.5% | 168.8 | 26.0% | 2003 | 151,015 | 1.7% | 6,067.3 | 5.1% |
| 1944 | 61,573 | 1.3% | 191.3 | 13.3% | 2004 | 153,435 | 1.6% | 6,418.3 | 5.8% |
| 1945 | 62,335 | 1.2% | 215.6 | 12.7% | 2005 | 155,905 | 1.6% | 6,681.9 | 4.1% |
| 1946 | 63,195 | 1.4% | 226.4 | 5.0% | 2006 | 158,275 | 1.5% | 7,071.6 | 5.8% |
| 1947 | 64,095 | 1.4% | 238.0 | 5.1% | 2007 | 160,625 | 1.5% | 7,471.6 | 5.7% |
| 1948 | 65,027 | 1.5% | 234.6 | -1.4% | 2008 | 162,925 | 1.4% | 8,192.1 | 9.6% |
| 1949 | 65,991 | 1.5% | 234.0 | -0.3% | 2009 | 165,415 | 1.5% | 8,496.0 | 3.7% |
| 1950 | 66,870 | 1.3% | 244.5 | 4.5% | 2010 | 168,246 | 1.7% | 8,801.8 | 3.6% |
| 1951 | 67,753 | 1.3% | 258.1 | 5.6% | 2011 | 171,145 | 1.7% | 9,660.1 | 9.8% |
| 1952 | 68,621 | 1.3% | 268.1 | 3.8% | 2012 | 174,057 | 1.7% | 10,459.7 | 8.3% |
| 1953 | 69,485 | 1.3% | 271.0 | 1.1% | 2013 | 177,196 | 1.8% | 11,035.0 | 5.5% |
| 1954 | 70,450 | 1.4% | 278.4 | 2.7% | 2014 | 180,571 | 1.9% | 11,684.9 | 5.9% |
| 1955 | 71,397 | 1.3% | 284.6 | 2.2% | 2015 | 183,945 | 1.9% | 12,346.8 | 5.7% |
| 1956 | 72,375 | 1.4% | 288.1 | 1.3% | 2016 | 187,498 | 1.9% | 13,213.4 | 7.0% |
| 1957 | 73,395 | 1.4% | 286.0 | -0.7% | 2017 | 191,048 | 1.9% | 13,857.9 | 4.9% |
| 1958 | 74,445 | 1.4% | 297.0 | 3.8% | 2018 | 194,693 | 1.9% | 14,362.7 | 3.6% |
| 1959 | 75,575 | 1.5% | 298.6 | 0.6% | 2019 | 198,295 | 1.9% | 15,320.7 | 6.7% |
| 1960 | 76,765 | 1.6% | 312.4 | 4.6% | 2020 | 201,738 | 1.7% | 19,114.6 | 24.8% |
| 1961 | 77,995 | 1.6% | 335.5 | 7.4% | 2021 | 205,309 | 1.8% | 21,546.6 | 12.7% |
| 1962 | 79,285 | 1.7% | 362.7 | 8.1% | 2022 | 208,921 | 1.8% | 21,346.3 | -0.9% |
| 1963 | 80,625 | 1.7% | 393.2 | 8.4% | 2023 | 212,582 | 1.8% | 20,827.2 | -2.4% |
| 1964 | 82,015 | 1.7% | 424.7 | 8.0% | |||||
| 1965 | 83,455 | 1.8% | 459.2 | 8.1% | |||||
| 1966 | 84,905 | 1.7% | 480.2 | 4.6% | |||||
| 1967 | 86,325 | 1.7% | 524.8 | 9.3% | |||||
| 1968 | 87,765 | 1.7% | 566.8 | 8.0% | |||||
| 1969 | 89,215 | 1.7% | 587.9 | 3.7% |
Annual gold production is relatively small
What does this mean in concrete terms? If mine production were to double – which is extremely unlikely – this would only mean an increase of 3.4% for the total stock of gold. This would still be a relatively insignificant inflation of the gold stock, especially compared to the current central bank inflation. If, on the other hand, production were to cease for a year, this would also have little impact on the total stock and pricing. If, on the other hand, a significant proportion of oil production were to be lost for a longer period of time, stocks would be depleted after a few weeks. Strong increases or decreases in production can therefore be absorbed much more easily.
We therefore assume that gold is not so valuable because it is so rare, but quite the opposite: gold is valued so highly because the annual production is so low in relation to the stock. This characteristic has been acquired over the centuries and can no longer change. This stability and security is a key prerequisite for creating trust. This clearly distinguishes gold as a monetary metal from other commodities and precious metals. Commodities are consumed, while gold is hoarded. This also explains why conventional supply/demand models can only be used to a limited extent on the gold market. Or as Robert Blumen once put it: “Contrary to the consumption model, the price of gold does clear the supply of recently mined gold against coin buyers; it clears all buyers against all sellers and holders. The amount of gold available at any price depends largely on the preferences of existing gold owners, because they own most of the gold.”[1]
For a commodity that is consumed, a rising deficit would clearly trigger higher prices until equilibrium is restored. Not so with a good that is hoarded. A simple consumption model therefore only works for goods that are consumed and whose annual production is high in relation to the stock (= low stock-to-flow ratio).
Current mining costs are insignificant for the gold price
This is why the production costs of gold play a subordinate role in pricing. They are primarily relevant for the performance of gold stocks. In our opinion, analyses that state that the gold price cannot fall below production costs are based on a fundamental fallacy. Although mining would be uneconomical for the majority of mine operators above a certain price, trading in gold that has already been mined would not come to a standstill. While mining therefore has little influence on the gold price, the reverse is not true. The gold price naturally has a considerable influence on mining and its profitability.[2]
There is no generally equal production cost rate for all mines – the costs depend on the characteristics of the mine and the reserves. Even the cost of producing individual ounces from the same mine can vary. The gold price in relation to labor costs and the cost price of capital goods determines whether a mine is profitable or not, and what gold can be profitably extracted from a mine. As the price of gold rises in relation to production costs, previously unprofitable reserves can become profitable to mine.
The demand side consists of investors, the jewelry industry, central banks and industry. However, this is actually only a fraction of the total demand. The majority of demand is so-called reservation demand. This term describes gold owners who do not want to sell gold at the current level. By not selling at the current price level, they are responsible for ensuring that the price remains at the same level.[3]
The decision not to sell gold at the current price level is therefore just as important as the decision to buy gold. The net effect on price discovery is the same. The supply of gold is therefore always high. At a price of USD 5,000, the supply of old gold would amount to a multiple of annual production. This also explains why the much-cited “gold deficit” is a myth and why there can be no shortage. Robert Blumen once formulated this aspect as follows: “Gold is an asset. Supply and demand should be understood in the same way that we understand the shares of a company. Every time shares change hands, the shares are demanded by a buyer and supplied by a seller. For each and every transaction, supply equals demand. Adding up all of the transactions that occur on a particular exchange, over the course of a month or a year, tells you absolutely nothing…If you said that buyers in China had bought 100 million shares of Microsoft but ‘no supplier could supply that many shares,’ nor was the company issuing enough new shares to meet the demand, you would readily see the error in that statement… Everyone understands that new shares only dilute the value of the existing shareholders, that it is not required for a company to issue new shares for the price to go up or down and that most trading of shares consists of existing shareholders selling to people who have dollars.”[4]
Just as increasing the money supply dilutes the purchasing power of the money in circulation and issuing new shares leads to a dilution of the old ones, an increase in the supply of gold should be seen as a dilution of the existing supply. An increase of 1% is absorbed by the market by the price falling by 1%, while the nominal supply remains the same.
With the exception of the past four years, there is a clear positive correlation between the gold price in US dollars and the expanding supply of recycled gold. The low volume of recycled gold in relation to the gold price over the past four years could indicate that market participants are becoming accustomed to the higher price level and will only sell at significantly higher price levels. It also appears that gold is gradually moving from shaky to firm hands.
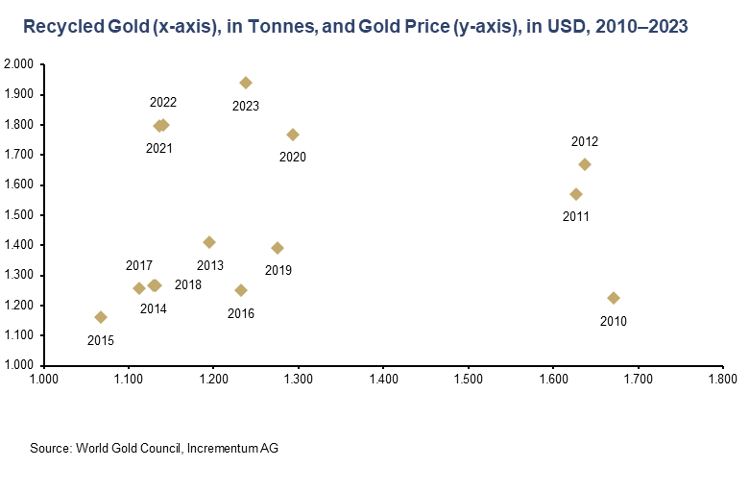
Whenever someone sells, it means that the gold price has reached its reserve price. Thus, someone is selling to someone with an implicitly higher reservation price – which results from the fact that they are willing to buy at that price. This means that larger sales (for example by central banks) contribute to an improvement in the market structure.
Conclusion
The gold market should be seen as a holistic market. In our opinion, the distinction between annual new supply and total supply is incorrect and leads to false conclusions. All sources of supply are of equal value, as every ounce of gold available for sale is in competition with other ounces. It does not matter whether the gold was mined 3,000 years ago or 3 months ago or consists of recycled dental gold, for example. The current annual gold production of more than 3,600 tons is therefore relatively insignificant for pricing.
Annual gold production is also only subject to very minor fluctuations, in contrast to fiat money, whose annual rate of change fluctuates strongly. Over the past quarter of a century, M1 for the euro has fluctuated on a quarterly basis between just under -10% in Q3/2023 and +17% in Q4/2005, while M2 for the US dollar has gone from -4.1% in Q2/2023 to more than +25% in Q1/2021. Ludwig von Mises summarized these theoretical findings perfectly: “If a thing has to be used as a medium of exchange, public opinion must not believe that the quantity of this thing will increase beyond all bounds.”
[1] Blumen, Robert: “Does Gold Mining Matter?”, Mises Institute, August 14, 2009
[2] See Blumen, Robert: “Does Gold Mining Matter?”, Mises Institute, August 14, 2009
[3] See Blumen, Robert: „WSJ does not understand how the gold price is formed“, May 30, 2010
[4] Blumen, Robert: “Does Gold Mining Matter?”, Mises Institute, August 14, 2009
GOLD AND SILVER ENTERING EXPONENTIAL PHASE
In this brief, 13-minute compilation of insights from 2023, VON GREYERZ, AG partner, Matthew Piepenburg, reminds us of prior warnings which are truer than ever (and playing out) today as the stock market totally divorces itself from the real (and recessionary) economy. There’s a reason gold is spiking, for despite a Fed-driven and hence entirely “Pavlovian” S&P, recessionary forces will force further currency debasement to monetize unsustainable debt levels. Looking purely at the recessionary forces of 2023, which Piepenburg bluntly unpacks with data rather than drama, the current disconnect between rising markets and a bleeding economy into 2024 should have all investors thinking carefully about what lies ahead, including an inflationary endgame which Piepenburg will unpack in subsequent video compilations.
For now, keep the economic facts discussed here clear in mind when positioning and protecting your wealth, and hence gold, in the currents to come.
GOLD AND SILVER ENTERING EXPONENTIAL PHASE
If you want to understand the direction of debt, rates, the USD, inflation, risk asset markets, gold and the US endgame, it might be better not to listen to the experts.
In fact, Johnny cash Cash is a far better source…
Five Feet High & Rising
In a classic 1959 tune by Johnny Cash, the singer asks: “How high’s the water mama?”
This question is then answered by a riff which chants, “she said it’s two feet high and risin.’”
And with each subsequent refrain, the water level goes to three feet, four feet and then five feet, “high and risin’.”
In short: An obvious flood.
And when it comes to debt in the land of the world reserve currency, Johnny Cash may have something to teach Jerome Powell and the other DC children drowning the US (and its debt-soaked Dollar) into a slow but steady debt flood.
Boring?
I’ve often said that good journalism, like honest economics, is boring.
One has to understand “hard” indicators like bond yields (which move inversely to bond price) and the high-school level basics of supply and demand forces.
But as I’ve also said countless times, and will say countless times more: The bond market is THE thing, because bonds are all about DEBT.
If you understand bonds, and in particular, the Fed’s hidden (real) mandate to save Uncle Sam’s sovereign IOU’s from sinking in price, then you will be able to easily foresee (rather than date predict) the future of risk assets, gold, BTC, the USD and yes, inflation.
The complex truly is that simple.
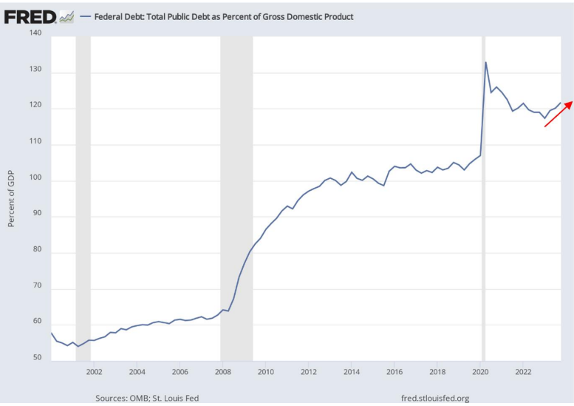
How High’s the Debt Mama? 120% and Risin’
And if you turn to Johnny Cash and ask “How high’s the debt level mama?” well… the blunt answer informs just about everything you need to know.
So, let’s keep it simple.
Simple, Not Boring
Debt is WHERE it all begins, and it tells you exactly HOW the American song ends.
And just how high is the water (debt) mama?
Ten years ago, US public debt was $17T “and risin’.”
Today it’s $34.5T “and risin’.”
America’s debt to GDP is 120%, its deficit to GDP is around 6%, and every 100 days we add another $1T in borrowing to our shameless bar tab of debt addiction masquerading as capitalism.
Even our own Congressional Budget Office will confess that unless we issue more debt (and print more debased money to monetize it), our Medicare and social security piggy bank will be empty by 2030.
Meanwhile, the USA is staring down the barrel of $212T in unfunded liabilities yet only $190T in assets.
In other words, and based on objective math, America literally has the balance sheet of a banana republic.
No Crisis?
Apologists (i.e., truth and math-challenged politicos), however, will tell you there is no crisis, even as the water levels rise past our closed eyes.
The clever ones will remind us that America’s USD comprises 85% of FX transactions, the vast bulk (80%) of international trade settlements, and is in constant “milk-shake” demand from the Eurodollar, derivative and SWIFT payment systems.
In other words, the Dollar is gonna be just fine.
Hmmm…
Facts vs. “Just Fine”
As warned from day-1 of the myopic (and suicidal) sanctions against Putin in which the US weaponized the world reserve currency, those days of a “just fine” USD simply ended.
Not all at once, but slow and steady, like a flood’s water line…
In just 2 years, we’ve seen undeniable signs of de-dollarization from the BRICS+ nations and an extraordinarily telling shift in the petrodollar dynamics (20% of 2023 global oil sold outside the USD), which would have been otherwise unimaginable in the pre-sanction era.
But, if you remain convinced that America and its reserve currency have magical immunity from the de-dollarization’s slow drip greenback demise, let’s get back to the oh-so boring but oh-so honest cries of the US Treasury market.
Why?
Again. Because the bond market is everything.
As important, the bond market has everything to do with debt, and current US debt is drowning the nation and diluting the USD, one slow trillion at a time.
Sound sensational?
Pounding A Fact-Based Fist
For years, I have pounded my fist reminding readers and viewers that debt destroys nations and currencies. Every time, and without exception.
And for years I have pounded my fist saying that Powell’s “war on inflation” was a ruse, as every debt-soaked nation needs to debase its currency to inflate away debt.
And from day-1 of Powell’s claim (lie) that inflation was “transitory,” I’ve been calling his bluff.
For years, I’ve argued that the Fed would simply lie about inflation (i.e., grossly under-report it) in order to make it appear statistically lower than what we actually knew/felt it to be.
Even Larry Summers, who is the classic arsonist (from his repeal of Glass-Steagall to deregulating the derivatives markets) now playing at fireman, has publicly stated that the actual US CPI scale, using pre-1983 housing methods, peaked last year at 18%, not the official 3.7% range…
If we then tack on a US debt/GDP ratio that is 30% higher today than in 2009, we mathematically see that despite Powell’s repressive “higher-for-longer” rate polices, we’ve made zero dent in our debt—instead, we’ve increased it.
In other words, our war against inflation is a loss; and our debts have increased.
And in the last couple of years, I’ve been pounding my fist that Powell would pivot from rising rates, to pausing rate cuts to eventually cutting rates followed in turn by outright money printing (or rather mouse-clicking Dollars) to “pay” Uncle Sam’s debt at the expense of our currency via what Luke Gromen calls “super QE.”
And all modesty aside, I think I/we have been right…
Right or Wrong?
Already, and as of last week, Powell has openly projected rate cuts in 2024, and they are likely to come by or near September.
We’ll see.
For now, just the promise (words) of rate cuts have been enough to send Pavlovian (Fed-dependent) markets to all-time-highs despite a real economy already under water.
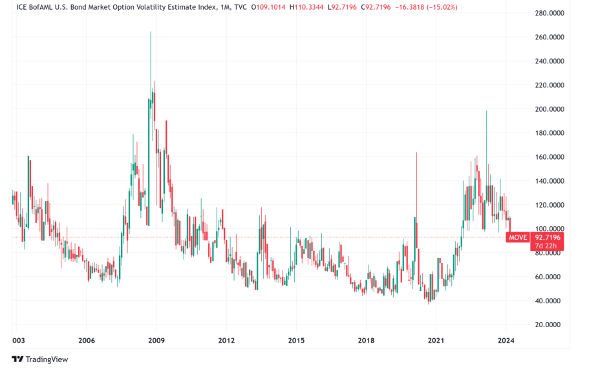
And the subsequent decline in the Market Option Volatility Estimate (“MOVE” Index) was a neon-flashing sign that the market is getting ready for a new flood of dollar-diluting liquidity…
Where’s the QE, Matt?
But what about my forewarned QE?
What about that ultimate moment when Powell admits full defeat in his so-called “war” on inflation (while quietly seeking inflation) and openly does what many off us (nod again to Luke Gromen et al) already know he will do, that is: Debase the currency to “save” a rigged-to-fail (i.e., debt-based) USA?
Clearly, it seems, I/we have been wrong about that QE, no?
Well…Not so fast.
Coming Through the Back Door
In fact, Powell, along with his former Fed colleague-turned-mind-numbing Treasury Secretary, Janet Yellen, have been doing un-noticed back-door QE at staggering levels too complex (or obvious) for the mental midgets in our so-called main stream media to even notice.
Shocker? Hardly…
Facts Are Stubborn Things
The fact is that five times in the last four years, DC has been doing QE by just another name (what I call “backdoor QE”) to avoid the embarrassment of direct QE.
Notwithstanding the “not-QE” (which really was QE) in 2019 when the Fed bailed out a cash-dry repo market (which, by design, no one understood), the DC magicians have been doing trillions worth of QE-like liquidity measures without having to call it, well QE…
That is, the Fed and Treasury Dept. have been pulling liquidity out of the drying Treasury General Account, the now retired “BTFP” measures, and the intentionally confusing reverse repo markets.
More recently (and equally as well intentionally confusing to the masses), the Fed is quietly on the verge of allowing the Fed banks to use unlimited leverage to buy unlimited amounts of USTs off the Fed’s balance sheet via the removal of what the fancy lads call “Supplementary Reserve Ratios.”
This latest trick, by the way, is just off-balance sheet QE, and yet another symptom of the big banks becoming branch offices of the Fed, as our already centralized America becomes even more grotesquely, well…centralized, which is a classic symptom of a desperate and debt-soaked regime.
But just in case none of the foregoing tricks of backdoor QE have convinced you of what basically amounts to just QE, we can get our clearest signals from—you guessed it: THE BOND MARKET.
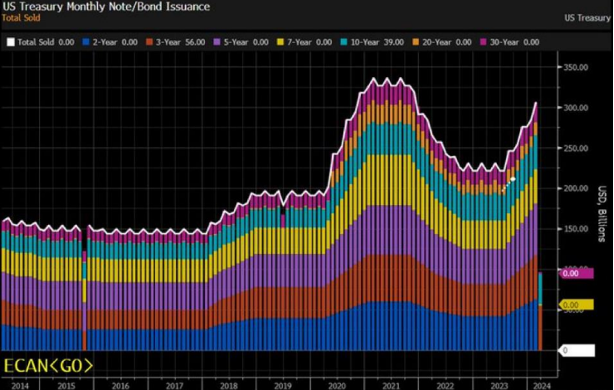
That is, one of the most obvious examples of “backdoor QE” is the Treasury Department’s open yet ignored trick of issuing most of its recent debt from the short duration end of the yield curve.
What The T-Bills Are Saying
By issuing more short-term IOUs in the form of T-Bills, this takes the supply-push inflation pressure off the openly unloved 10Y USTs, whose price declines (and subsequent as well as fatally unpayable yield/rate spikes) not only crushed regional banks, but Uncle Sam’s wallet as well.
OK. Yield curves and duration implications may sound, well… boring, but stick with me because this really, really matters.
The extreme levels of T-Bill issuance (as opposed to 10Y IOUs) has immense implications and is a flashing neon sign that the US is not heading into an economic crisis, but is in fact, ALREADY in a crisis.
Today, T-Bill issuance is at a two-decade high, and comprises greater than 85% of all US Treasury issuance.
This short-end issuance is far more like QE, i.e. simple money printing—which, we remind you, is highly inflationary/reflationary.
Hard to believe? See for yourself:
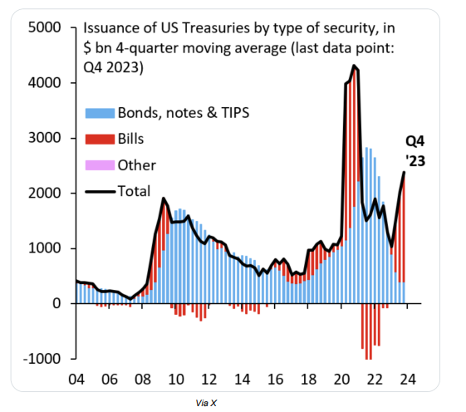
The last time we saw such QE-like desperation from the T-Bill side of the yield curve was during the Great Financial Crisis and the COVID crisis.
No Crisis? Huh?
But according to our so-called “leaders,” we are not at all in a crisis today. As they keep reminding us, we are at “full employment” (eh-hmmm) and nominal GDP is growing at 6%.
Then again, nominal GDP “growing” on the back of over $23T in UST issuance (bonds, notes and bills) is simply debt-driven “growth,” and debt-driven growth is not growth, it’s just debt.
In short, and as Luke Gromen concluded far better than I: “You know the debt crisis is real when the US resorts to short-term debt issuance.”
Summing Up
Whenever one is dealing with truth-challenged profiles like the Fed, Treasury Dept or White House, it is far better/simpler to watch what they do rather than what they say, as the difference is approximately 180 degrees…
All of the evidence above (from debt levels, de-dollarization trends, petrodollar shifts, backdoor QE measures and T-Bill over-issuance) screams of an open and obvious debt crisis which ALWAYS indicates a consequent currency crisis.
Always.
And as I have said for years, including a public discussion with Brent Johnson, the US can’t afford a strong USD because its debt levels require a weaker, inflated USD, regardless of its “relative”/DXY “strength.”
The string cite of evidence above (and beyond just rate cuts) is simply a cleverly veiled way of the Fed and Treasury telling us they want (need) a much weaker USD to save their necks at the expense of the dollar in your portfolio, checking account or wallet.
Gold, of course, is sniffing this out.
So are the stock markets and BTC.
So are the global central banks, who are stacking gold and dumping USTs at record levels.
The COMEX and London exchanges are also sniffing this out, as physical gold and silver is going from churn motions to actual physical delivery at record levels.
Meanwhile, even the BIS has made gold a Tier-1 asset.
Just saying…
The empirical (rather than “sensational”) evidence of an unloved UST and distrusted (debased and weaponized) USD is there for all who have eyes to see and ears to hear.
Gold has hit all-time-highs (and will go much, much higher) simply because the USD is going much, much lower.
But, of course, no one in DC will say the quiet part out loud.
GOLD AND SILVER ENTERING EXPONENTIAL PHASE
The world’s best kept investment secret is GOLD.
- Gold has gone up 7.5X this century
- Gold Compound annual return since 2000 is 9.2%
- Dow Jones Compound annual return since 2000 is 7.7% incl. reinvested dividends
So why are only 0.6% of global financial assets in gold?
The simple answer is that most investors don’t understand gold because governments suppress the virtues of gold.
GOVERNMENTS WILL ALWAYS LIE TO THEIR PEOPLE
Has anyone ever heard a Western government tell their people that gold is the best protection against their government’s total mismanagement of the economy and their currency?
Has any government ever told their people that throughout history all governments, without fail, have destroyed the total value of the people’s money?
That includes every single currency in history since no currency has ever survived.
And have current governments told their people that since 1971, their currencies have declined by 97% to 99%?
So why don’t governments tell their people that in the next 50-100 years their currency will lose another 97-100%?
Obviously, no government would ever be elected if they told their people the truth that the economy and their money will continue to be mismanaged and destroyed like it has throughout history.
And why don’t governments study history where they could learn from their predecessors mistakes?
And why don’t journalists study the history of money and educate the people?
The answer is obvious, journalism is just government propaganda and there is not a serious investigative journalist around today.
INVESTMENT MANAGEMENT INDUSTRY IN DENIAL.
In addition, the whole investment management industry neither understands nor likes gold.
Studying and understanding money doesn’t serve their purpose. Better to create a mystique around a mediocre industry that on average underperforms the market.
A greedy and self-serving investment management industry is not interested in gold. Gold doesn’t allow them to churn commission which is important for their survival.
This whole industry could be abolished with most investments being held in index funds and physical gold. The net performance would most probably be superior to a very and inefficient industry.
DRIVERS FOR GOLD
In the 12 minute video extract from a Palisade Radio interview below, I discuss the drivers for gold.
In summary the important drivers discussed which will soon propel gold to much higher levels are:
- Global deficits & debts – US, Europe, China, Japan, Emerging markets
- War
- Social unrest
- Gold buying by BRICS countries
- Central bank gold purchases of gold due to move from Dollar reserve assets to Gold
GOLD IS THE BEST WEALTH PRESERVATION ASSET THROUGHOUT HISTORY
- Gold is not an investment. It is nature’s money and thus the only money which has survived in history.
- Governments and Central Banks are Gold’s best friend. Throughout history they have without fail destroyed the value of Fiat money whilst Gold has for thousands of years maintained its purchasing power.
- As I discuss in the interview, risk is today greater globally than any time in history.
- Physical Gold is the ultimate protection against such risk.
- Gold for WEALTH PRESERVATION purposes must be held in physical form with direct access by the investor.
- Gold must obviously be held outside a fractured financial system. No use holding your gold in the system that you are protecting against.
- NEVER, EVER hold gold in paper form or ETFs.
- Gold must be held in a safe jurisdiction outside your country of residence and especially outside the US, Canada and the EU.
- Gold and Silver are not just for the wealthy. You can buy 1 gram for $70 or one ounce of silver for $25.
- With major bubbles in virtually all asset classes including stocks, bonds and property, the allocation to physical gold and some silver should be at least 25% of your financial assets and potentially much more.
NEVER worry about the gold price. Governments will continue to devalue your fiat money and thus revalue gold as they have throughout history.
GOLD AND SILVER ENTERING EXPONENTIAL PHASE
In this unique compilation of interviews made throughout 2023, VON GREYERZ partner, Matthew Piepenburg, squarely addresses the key themes and questions regarding physical gold ownership. Not surprisingly, so many of the trends (inflation, rates, Fed policy and gold pricing) which Piepenburg tracked throughout 2023 are clearly playing out/confirmed in real time as we move into 2024.
In this highly informative (one-stop) survey of gold as an asset class, Piepenburg turns his attention to the core gold themes and questions, namely:
-Why doesn’t everyone own gold?
-What has gold done for you lately?
-How does gold compare to stocks and bonds? To currencies?
-Where is gold heading? In Price? In value?
-What about BTC?
-Is the USD going up or down in general?
-What are the key risks for which gold protects?
-How and where should gold be owned and not owned?
-Gold investing vs. Gold speculating: What’s the difference?
-How trapped is the Fed and what’s coming for banks, rates, markets and gold?
-Is a gold-backed currency inevitable? Necessary?
-What does the new oil trade say about the USD? Gold?
-How real is the de-dollarization influence on the gold price?
-How does mistrust in currencies, sovereign bonds and political systems play out going forward?
All of these critical questions, as well as the implications behind these themes and trends, are squarely addressed. We hope you enjoy this educational, as well as easily understood/plain-spoken “big picture” gold discussion. Gold emerges throughout this compilation of discussions as a now undeniably important asset to help far-sighted investors prepare for the changes happening today and coming at greater speed tomorrow.
GOLD AND SILVER ENTERING EXPONENTIAL PHASE
In this fact-packed, 30-minute conversation, VON GREYERZ partner, Matthew Piepenburg, joins Jesse Day of Commodity Culture to make sense of the growing list of dislocations in debt, currency and financial markets, all of which serve as longer-term tailwinds for gold.
Piepenburg begins with a blunt analysis of the broad market, drawing from his own prior experiences on Wall Street in general and within the hedge fund space in particular. Taking both sides of the S&P bull and bear case, Piepenburg concludes, with evidence, that we are in fact seeing a classic “bubble” in equities. Toward this end, he explains how bubbles rise on net-income expansions and then pop on net-income contractions. The current S&P, which is comically narrow and what he describes as little more than a veritable “tech ETF,” offers far greater risk today than in prior bubbles (2001, 2008). This is because we are now seeing an equity melt-up in the backdrop of technical recessions from Germany to China (and ignored in the US…). In short, the timing, and irony, of a Fed-driven bubble in the backdrop of record-high global debt and recessionary trends could not be worse. Piepenburg then provides certain warnings and insights for those chasing the current tops.
Naturally, the core of the conversation turns to gold matters, which equally involves currency matters. In particular, Piepenburg offers his evolving views on de-dollarization themes/realities, but does not foresee a gold-backed BRICS currency. Instead, and equally bullish for gold, he sees more and more nations trading outside of the USD and/or net-settling trades in gold. The evidence of this growing trend is now openly undeniable, and he makes a clear case of this evidence, point by point, event by event—including dramatically important changes in the USD oil trade, which he addresses in detail.
Silver, Piepenburg quotes Egon von Greyerz, is “not for widows and orphans,” but is coiled for an inevitable spring forward based on the hard math of supply constraints and radical (one-way) physical silver deliveries out of the NY and London exchanges.
The conversation further includes key insights on recessionary, currency and inflation forces, all of which foretell a mathematically inevitable rise in the gold price. Piepenburg closes by reminding listeners to not only understand why one should own gold, but as importantly, HOW one should own gold, a theme which VON GREYERZ, AG (and Egon von Greyerz himself) has understood since its inception.
GOLD AND SILVER ENTERING EXPONENTIAL PHASE
As is historically typical of all corrupted and objectively bankrupt nations, the truth is often as hard to find as an honest man in parliament.
Thus, if you want to see what’s most true, and embarrassing (and directly linked) to desperately cornered power-brokers increasingly enamored by the centralizing marriage of corporate influence and government opportunists (currently masquerading as “democracy”), the best evidence of genuine reality often lies in what is deliberately omitted from the headlines and public discussion.
Stated otherwise, the devil doesn’t just lie in the details, it lies in what is deliberately ignored, omitted or censored.
As any serious devotee of history (now increasingly cancelled as “elitist”) already knows, there’s no greater power than the power to control the two key levers of society, namely: 1) information and 2) money.
Unfortunately, even in the land of the free, neither of these forces (from genuine capitalism to the fourth estate) serve its deliberately “tribalized” citizenry. Our so-called free press (aka “legacy media”) is anything but free, and our “independent” Federal Reserve is anything but Federal, a reserve or independent.
The ironies just abound.
Between the corporate media and the central bank, it’s fairly clear that both of these time-honored institutions are now openly in bed with big government.
This is not fable, but fact. It’s also ominous.
How Information is Controlled
Note, for example, how the obvious blunders of the “safe and effective” COVID policies/failures of late (from hysterical and global mandates, lab-leak denials, and excess-death math to the global gaslighting of the un-vaxed) have been curiously absent from the headlines or public debate, when just over a year ago this “crisis” was the center of all our lives.
Attempts by the French legislature were even made to fine or jail those criticizing the vaccine. It seems, for some, at least, that Liberté, Égalité, Fraternité has become a convenient phrase rather than guiding ideal. C’est la vie…
More, however, can be said of the strangely silent headlines on the blatant (and finally confirmed) illegality of Trudeau’s invoking of emergency powers to criminalize truckers’ collective expression of free speech and dissent in Canada, or the demonizing of veterans who question the neocon’s US proxy war in the Ukraine as “unpatriotic” or a threat to “national security.”
In short, if you want to see the truth of what scares the power-brokers whose policies defy the open common sense of the common man (which Walt Whitman described as the true spirit of any nation), just look at what those clinging to power deny, hide from, cancel, censor, confuse or punish.
Or to paraphrase Shakespeare, they “doth protest too much,” for they know they are in the wrong.
How Money is Controlled
Turning from the centralization of information toward the centralization of money, the template is no different.
Obfuscation, devilish little details and outright absence of discussion and headlines are where you find the darker truths behind our entirely rigged-to-fail financial system, which as we’ve shouted from the rooftops with facts rather than fear, is little more than a modern feudalism of insider lords and public serfs.
As we’ve warned for years, solving a debt crisis with more debt, which is then paid for with money mouse-clicked out of thin air, is not policy—it’s fantasy.
We’ve also warned that at some point this fantasy (and debt addiction) will lead to not only more lies, more wars and more centralization by the state (as well as a pretextfor dystopian CBDC), but to an inflationary QE endgame/hangover of currency destruction interrupted by a conveniently deflationary (and openly denied) recession.
This is because a government $34T (and counting) out of debt control will have no choice but to take full control over our markets and money via capital controls, yield curve controls and more currency-killing QE to provide fake liquidity to a fake (Fed-driven/deficit-driven) market and economy.
Memories Are Short, Headlines Are Empty
Remember when Bernanke, for example, said QE would be “temporary”? What followed was QE 2,3,4, Operation Twist and then unlimited QE in 2020.
Remember when he also said such magical money would have no impact on the currency, which is the same thing Nixon said when he decoupled from gold in 1971?
What followed was a 98% decline in the USD’s purchasing power when measured against a milligram of gold.
And now, with Powell (who also said inflation was “transitory”) still toe-dipping into QT and hawkish rates, he seems to think no more QE will be needed, and that even the rate cuts he promised months backed are now being back-stepped.
Why?
Because Powell, like all political figures (and the FED IS POLITICAL) is pathologically incapable of admitting error or offering transparency or accountability for the debt hole his Fed has dug for us since its creepy inception in 1913.
After his “higher-for-longer” fight against inflation (a ruse to re-load his rate gun for the next recession) knee-capped the middle class, regional banks, and small businesses in an economy that is witnessing the highest level of corporate bankruptcies and layoffs in over a decade, Powell is still relying on words rather than math.
In this way, he has tempted an appallingly narrow S&P (which is nothing more than a tech ETF led by five names) to all time highs on just the suggestion (rather than act) of rate cuts.
But as I’ve argued elsewhere, this S&P bubble couldn’t come at a worse time nor in a worse national and global setting.
More Currency-Killing QE Will Come
Despite (and frankly, because of) all this embarrassing (and ignored) disfunction, the inflationary QE will come.
In fact, it has been hiding in plain sight.
Five times in the last four years, the two-heads (Yellen and Powell) of the two-headed financial snake in DC have been quietly providing trillions in back-door QE in various forms yet completely off the public headline/radar.
That is, via emptying of the Treasury General Account, issuing unloved IOUs from different extremes of the yield curve and sucking liquidity from the Reverse Repo Markets, DC has managed to buy more fantasy and time from “back-door” sources of liquidity which are now tapping out.
But math, as well looking beyond the headlines, teaches us that front-door (i.e., direct) QE is only a matter of time—i.e., just one popping and deflationary S&P bubble away.
For now, of course, Powell can’t say the quiet part out loud, and the vast majority of children playing within our Congress can’t even count out it loud.
How Dumb is the CBO?
The Congressional Budget Office (CBO), for example, has already projected another $20T in US Federal Debt to be issued in the next 10 years.
If this number wasn’t so mind-numbingly shocking enough (yet largely ignored from the WSJ or NYT), what is even more comical (and mind-numbing) is that the same CBO also foresees NO recession in that 10-year projection.
Furthermore, the CBO is assuming that 10Y yields (i.e., interest rates) will be 40 basis points lower than they are today.
Wow.
The level of dishonesty, denial and/or outright stupidity in such a projection literally defies belief and hard reality.
Why?
First, the CBO is ignoring the recession we are already in.
Secondly, the only way for yields on the US 10Y to be lower than they are today is if someone (or some “thing”) actually buys Uncle Sam’s IOUs. (Yields move inversely to bond demand.)
Yet based on not only our last report on the most recent UST auction, and based far more importantly on the unspoken reality that global central banks have been net-sellers rather than buyers of USTs since 2014, one has to wonder from where those mathematical wonder kids at the CBO expect that bond demand to come?
The honest answer, of course, is that there are not enough natural buyers of our unloved IOUs.
This means the actual buying will come from a mouse-clicker at the Eccles Building, where zeros can be added to a balance sheet far easier than say…actual GDP.
Equally clear, is the fact that the trillions of such mouse-clicked dollars are fake dollars, and despite the ongoing debates between “base money” and “reserve notes,” QE IS inherently inflationary.
Powell, for all his faults, knows this.
But his political position (and hence proclivities) means he will continue to well… lie about the inevitability of more QE, more inflation and more currency debasement, which as we (and history) have also warned for years, is THE endgame.
New, Clever Little Lies and More Time-Buying at Your Expense
In the interim, the Fed and its sister little devil, the US Treasury Department, will come up with clever tricks to tell the surface truth while substantively (and simultaneously) lying.
In short, politics 101.
They do this via absolute confusion and brain-numbing details, acronyms and data hiding—i.e. “smoke and mirrors.”
For example, recently, the magicians in DC (namely, the ISDA, or “International Swaps & Derivatives Association) have asked the FED, the FDIC and the OCC (the Office of the Comptroller of the Currency) to reinstitute the UST exclusion for Supplementary Leverage Ratios (SLRs) at Federal Reserve Banks.
Most of you, of course, are saying: “What in the he_ _ does that mean?”
Well, that’s the entire point: You’re not supposed to understand, and you’re not supposed to notice.
Like all other pre-QE and current “backdoor QE” tricks, DC doesn’t want to show its bad poker hand.
That is, it doesn’t want you to know how broke(n) our dollar thirsty (i.e., debt-soaked) nation truly is.
In simple English, by excluding SLRs from calculations at the Fed banks (which was last done when markets tanked in April of 2020), banks are allowed to buy USTs with no reserve requirements (which essentially allows for unlimited leverage).
Or in even simpler English, this is just QE without the Fed having to say the “QE” part out loud.
Shocker?
Hardly. Just more words replacing bad math, which in my opinion, is the perfect description of the current financial cycle (or fourth turning…)
Takeaways?
Given that extreme liquidity, as well as extreme leverage, is THE trigger for extreme debt and then extreme disaster in markets and economies (a theme repeated from David Hume to von Mises, or Reinhart & Rogoff to Jeremy Grantham), those investors playing the long-game (rather than a Taylor Swift S&P) are thinking preparation not FOMO.
Rather than chase tops, the smart money is looking at assets that cannot be “popped” when all that is rosy today turns to blood in the streets tomorrow.
Currencies–for all the myriad reasons discussed elsewhere, from De-dollarization to central bank debasement and petrodollar divergence–will be hit even harder, and yes, the USD too.
This explains the breakout in anti-fiat assets like BTC and gold.
We are not going to compare “digital” gold and real gold here, but have long argued that they are not the same assets, stores of value or mediums of exchange. Nor are we here to critique fans of the former to highlight investors of the latter.
I love gold. This doesn’t mean I hate BTC. But there’s a difference.
What we do know, and can say, however, is that the world’s central banks are stacking physical gold at unprecedented levels and that the COMEX and London exchanges are seeing historical (and one-way) out-flows from these exchanges for the simple reason that the world wants gold– a tier-1 asset—far more than it wants a UST.
In short, seismic shifts are not coming, they are already happening to the currencies of distrusted and debt-heavy sovereigns.
Many, however, will still try to understand gold’s price moves in connection with (i.e., as a “correlation” to) Fed policies as to rates (up or down), bond yields (up or down), the DXY/USD (up or down) or CPI inflation (up or down).
What we are seeing however, is that gold breaks away from all standard “correlations” when nations tip toward chaos, which is what always follows a debt crisis.
The fact that Germany, the UK, Japan, South Korea and China are technically in recession, while America denies recession at home, suggests to us (gee whiz) that such chaos (financial, military, social, currency and political) is already upon us.
And as trust falls in such a backdrop of objectively neutered currencies, gold simply rises, because it’s real rather than paper money.
The BIS knows this, the world’s central banks know this. Wall Street legends know this.
And yes, gold just reached all time highs in USD terms. We all know this.
But there is much, much, more to come for gold, and for no other reason, than that there is sadly much, much more disfunction ahead in the financially upside-down (and debt-trapped) world which our leaders have handed us.
GOLD AND SILVER ENTERING EXPONENTIAL PHASE
In this engaging, 30-minute conversation, VON GREYERZ partner, Matthew Piepenburg, sits down with Liberty Finance’s Elijah Johnson to discuss Gold’s recent surpassing of the 2100 (USD) marker in the backdrop of an S&P totally disconnected from global and national economic warning signs. For Piepenburg, such price action in gold is no surprise, and in fact, is only just beginning as global and US debt levels tip toward the absurd while credit markets, currency markets and central bank policies near their cracking points. In addition to these much-discussed trends, Piepenburg also addresses the historical changes in the London and New York gold and silver exchanges, each of which are seeing massive (and one-way) deliveries OUT of their exchanges and into the waiting arms of central and commercial banks losing faith in the USD/UST. Instead, the bigger names are gathering a far safer Tier-1 asset (gold) in anticipation of seismic shifts in the global economy and financial markets. The implications of these deliveries out of the OTC exchanges are immense, as they strongly curtail the ability of the bullion banks to manipulate honest pricing in precious metals.
Piepenburg turns an equally concerned (yet characteristically blunt) eye toward an S&P breaking all-time highs on the backs of only five, highly over-valued names. For Piepenburg, this so-called “bullish” move in equities could not be further from the truth, as once this bubble “pops,” as all bubbles do (and Piepenburg explains HOW), there is literally no good “narrative” left for the US to cling to in its desperate attempts to confuse a bloated stock market with a “resilient” economy. For Piepenburg, such warnings are not just felt and shared by “gold bulls,” but equally so by a long list of esteemed portfolio managers, from Jeremy Grantham to Paul Singer. In short, the evidence of a dangerously topping and soon-to-be mean-reverting S&P are now undeniable.
The outlook for gold is ultimately so convincing and so strong because the outlook for cornered Fed officials and an openly trapped and bankrupt US economy is so week. As always, Piepenburg addresses these sober realities with facts rather than hyperbole. He closes the conversation reminding viewers that understanding WHY investors need gold is now fairly obvious, but further reminds that it is equally important to understand HOW to own/hold gold outside of the banking system, which of course, includes ETF or “paper” gold.
GOLD AND SILVER ENTERING EXPONENTIAL PHASE
All Empires die without fail, so do all Fiat currencies. But gold has been shining for 5000 years and as I explain in this article, Gold is likely to outshine virtually all assets in the next 5-10 years.
In early 2002 we made major investments in physical gold for our investors and ourselves. At the time gold was around $300. Our primary objective was wealth preservation. The Nasdaq had already crashed 67% but before the bottom was reached, it lost another 50%. The total loss was 80% with many companies going bankrupt.
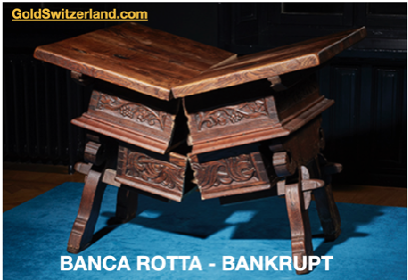
In 2006, just over 4 years later, the Great Financial Crisis started. In 2008, the financial system was minutes from imploding. Banks like JP Morgan, Morgan Stanley and many others were bankrupt – BANCA ROTTA – (see my article First Gradually then Suddenly, The Everything Collapse)
Virtually unlimited money printing postponed the collapse and since 2008 US total debt has almost doubled to $100 trillion.
Gold backing of a currency doesn’t always solve a debt problem but it certainly makes it more difficult for the government to cook the books which they do without fail.
BONFIRE OF THE US BUDGET BOOKS
So tricky Dick (Nixon) couldn’t make ends meet in the late 1960s – early 70s partly due to the Vietnam war.
Thus in 1971 Nixon, by closing the Gold window, started the most spectacular bonfire of the US government budget books. How wonderful, no more accountability, no more shackles and no more gold deliveries to de Gaulle in France who was clever to ask for gold instead of dollars in debt settlement from the US.
So from August 1971, the US embarked on a money printing and credit expansion bonanza never seen before in history.
Total US debt went from $2 trillion in 1971 to $200 trillion today – up 100X!
Since most major currencies were linked to the dollar under the Bretton Woods system, the closing of the gold window started a global free for all with the printing press (including bank credit) replacing REAL MONEY i.e. GOLD.
The consequences of this “temporary” move by Nixon is that all Fiat or paper money has declined by 97-99% since 1971.
The price of assets have obviously inflated correspondingly. In 1971 total US financial assets were $2 trillion. Today they are $130 trillion, up 65X.
And if we include off balance sheet assets including the shadow banking system and derivatives, we are looking at assets (which will become liabilities) in excess of $2 quadrillion.
I forecast the derivative bubble and demise of Credit Suisse in this article (Archegos & Credit Suisse – Tip of the Iceberg) and also in this one (The $2.3 Quadrillion Global Debt Time Bomb).
HEADS, GOLD WINS – TAILS, GOLD WINS
Luke Gromen in his Tree Rings report puts forward two options for the world economy which can be summarised as follows:
1. Dedollarisation continues, the Petrodollar dies and gold gradually replaces the dollar as a global commodity trading currency especially in the commodity rich BRICS countries. This would allow commodity prices to stay low as gold rises and drives a virtuous circle of global trade.
If the above option sounds too good to be true especially bearing in mind the bankrupt status of the global financial system, Luke puts forward a much less pleasant outcome.
And in my view, Luke’s alternative outcome is sadly more likely, namely:
2. “China, the US Treasury market, and the global economy implode spectacularly, sending the world into a new Great Depression, political instability, and possibly WW3…in which case, gold probably rises spectacularly all the same, as bonds and then equities scramble for one of the only assets with no counterparty risk – gold. (BTC is another.)”
Yes, Bitcoin could go to $1 million as I have often said but it could also go to Zero if it is banned. Too binary for me and not a good wealth preservation risk in any case.
As Gromen says, there is a virtuous case and there is a vicious case for the world economy.
But above both cases shines GOLD!
So why hold the worthless paper money or bubble assets when you can protect yourself with Gold!
FOR THE CBO BAD TIMES DON’T EXIST
The US Central Budget Office – CBO – has recently made a 10 year forecast.
Obviously, the CBO assumes no depression or even a little recession in the next 10 years!
Isn’t it wonderful to be a government employee and have a mandate to only forecast GOOD NEWS!
And although the CBO forecasts a debt increase of $21 trillion by 2034 to a total of $55 trillion, they expect inflation to stay around 2%!
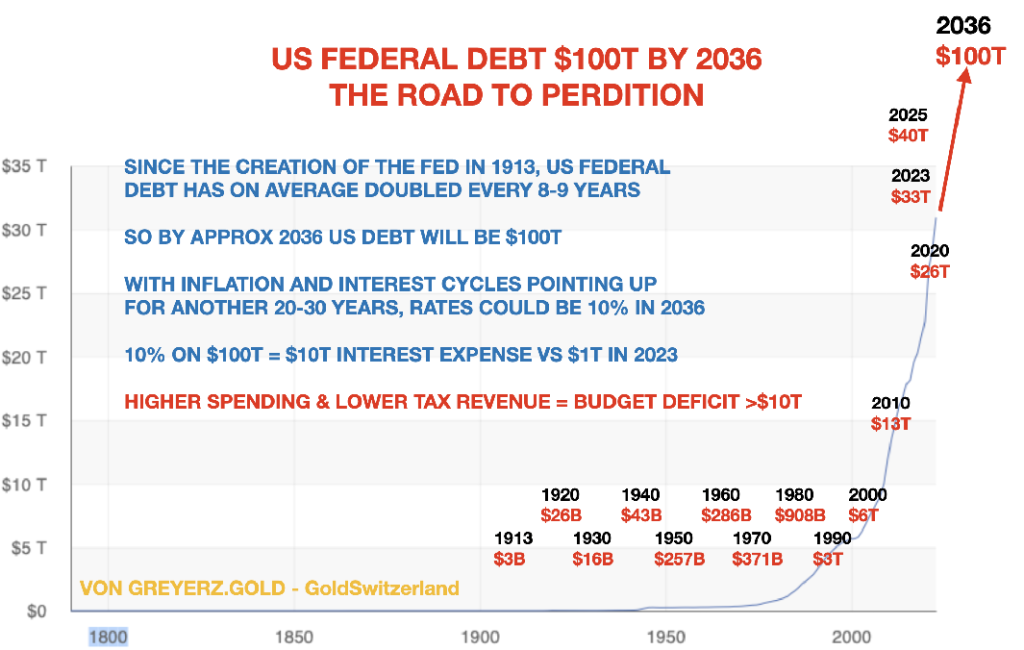
As I have stated in many articles, the US Federal debt has doubled every 8 years on average since Reagan became President in 1981!
I see no reason to deviate from that long term trend although there can be short term deviations. So based on that simple but historically accurate extrapolation, I could forecast the increase from $10 trillion to $20 trillion debt in 2009 when Obama took over from Bush Jr.
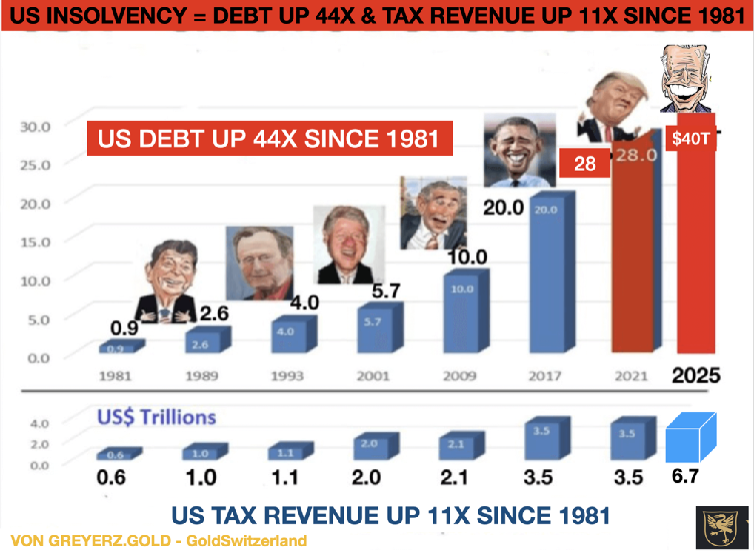
Extrapolating this trend, the US Federal Debt will reach $100 trillion in 2036.
With debts and deficits increasing exponentially, it is not unlikely that as inflation catches fire again, $100 trillion Federal Debt will be reached earlier than 2036.
Just think about a big number of bank failures, which is guaranteed, plus major defaults in the $2+ quadrillion derivative market. Against such dire background, it would be surprising if US debt doesn’t go far beyond $100 trillion by the mid 2030s!
STOCK MARKET BUBBLE & LEADERSHIP SWAPS
Investors and many analysts are still bullish about the stock market. As we know, markets will move higher until all investors, especially retail, are sucked in and until most of the shorts have liquidated their positions.
It has been a remarkable bull market based on unlimited debt creation. Nobody worries about the fact that 7 stocks are creating this mania. These stocks are well known to most investors: Alphabet (Google), Amazon, Apple, Meta (Facebook), Microsoft, Nvidia and Tesla.
These Magnificent 7 have a total market cap of $13 trillion. That is the same as the combined GDP of Germany, Japan, India and the UK! Only the US and China are bigger.
When 7 companies are greater than 4 of the biggest industrial economies in the world, it is time to fire the management of these countries and maybe do a swap.
GATES, COOK, MUSK TAKING OVER GERMANY, UK & FRANCE
What about Germany’s Chancellor Scholz running Amazon. Or Rishi Sunak in the UK being in charge of Microsoft? How long would it take them to destroy these companies? Not many years in my view. They would quickly double the benefits for workers and increase debts to unsustainable levels.

But Germany and the UK would most certainly benefit from Bill Gates of Microsoft taking on Germany and Tim Cook of Apple running the UK. They would of course need dictatorial powers in order to take the draconian measures required. Only then could they slash inefficiencies, halve benefits and reduce taxes by at least 50%.
If the entrepreneurs just got a very small percentage of the improvement in the countries’ finances as remuneration, they would make much more money than they are currently.

Even more fascinating would be to see Elon Musk as French President. He would fire at least 80% of state employees and by doing that he might even get the militant French unions on his side and get the country back on its feet.
An interesting thought experiment that of course will never happen.
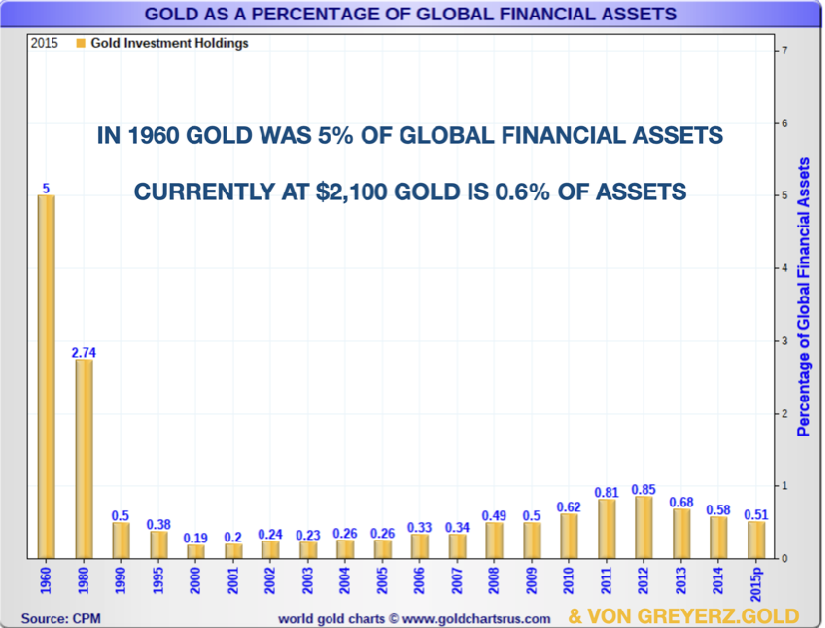
WHY IS EVERYONE WAITING FOR NEW GOLD HIGHS IN ORDER TO BUY???
For almost 25 years I have been standing on a soapbox to inform investors of the importance of wealth preservation.
Still only just over 0.5% of global financial assets have been invested in gold. In 1960 it was 5% in gold and in 1980 when gold peaked at $850, it was 2.7%.
For a quarter of a century, gold has gone up 7- 8X in most Western currencies and exponentially more in weak currencies like the Argentine Pesos or Venezuelan Bolivar.
In spite of gold outperforming most asset classes in this century, it remains at less than 1% of Global Financial Assets – GFA. Currently at $2,100 gold is at 0.6% of GFA.
WE HAVE LIFTOFF!
So gold has now broken out and very few investors are participating.
This stealth move that gold has made has left virtually every investor behind as this table shows:
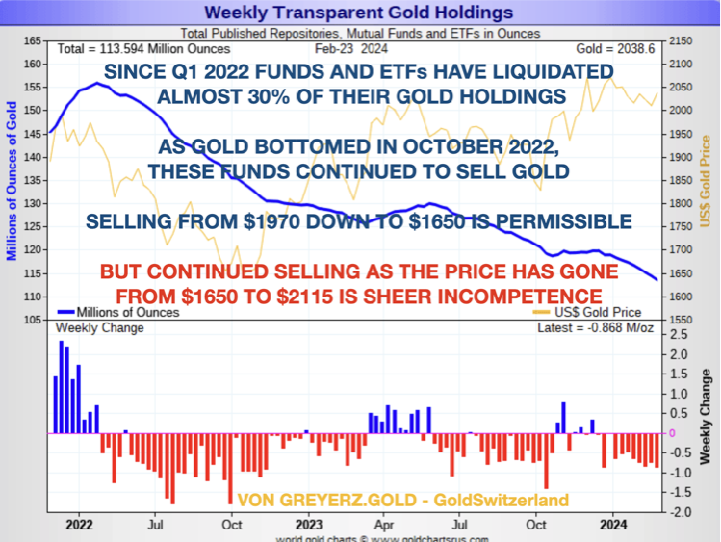
The clever buyers are of course the BRICS central banks. Almost all of their purchases are off market so in the short term it has only a marginal effect on the gold price.
But now the squeeze has started as my good friend Alasdair Macleod explains so well on King World News. The Comex was never meant for physical deliveries but only for cash settlements. But now buyers are standing for physical delivery. We have also seen last month major exports of gold from the US to Switzerland. These are either Comex 400 ounce bars or US government bars sold/leased and sent to the Swiss refiners and broken down to 1 kg bars for onwards export to the BRICS. These bars will never return again even if they are only leased and not sold.
The above process will one day bring panic to the gold market as there will be nowhere near enough physical gold for all the paper claims.
So for any gold investors who don’t hold physical gold in a safe jurisdiction (NOT USA), I suggest that they quickly move their gold to a private vault where they have personal access, preferably in Switzerland or Singapore.
So NO FRACTIONAL GOLD OWNERSHIP, NO GOLD ETFs or FUNDS and NO GOLD IN BANKS!
At least not if you want to be sure to get hold of your gold as the gold squeeze starts.
GOLD IS ON THE CUSP OF A MAJOR MOVE
Having just broken out, gold is now on its way to much, much higher levels.
As I keep on saying, forecasting the gold price is a mug’s game.
What is the purpose of predicting a price level when the unit you measure gold in (USD, EUR, GBP etc) is continually debasing and worth less every month.
All investors need to know is that every single currency in history has without fail gone to ZERO as Voltaire said already in 1727.
Since the early 1700s, over 500 currencies have become extinct, most of them due to hyperinflation.
Only since 1971 all major currencies have lost 97-99% of their purchasing power measured in gold. In the next 5-10 years they will lose the remaining 1-3% which of course is 100% from here.
But gold will not only continue to maintain purchasing power, it will do substantially better. This is due to the coming collapse of all bubble assets – Stocks, Bonds, Property etc. The world will not be able to avoid the Everything Collapse or First Gradually then Suddenly – The Everything Collapse as I wrote about in two articles in 2023.
YES, GOLD IS ON THE CUSP OF A MAJOR MOVE AS:
- Wars continue to ravage the world.
- Inflation rises strongly due to ever increasing debts and deficits.
- Currency continues their journey to ZERO.
- The world flees from stocks, bonds, and the US dollar.
- The BRICS countries continue to buy ever bigger amounts of gold.
- Central Banks buy major amounts of gold as currency reserves instead of US dollars.
- Investors rush into gold at any price to preserve their wealth.
GOLD AS CHEAP AS IN 1971 OR 2000
The chart below indicates that gold in early 2020 at $1700 was as cheap as in 1971 at $35 and in 2000 at $300 in relation to money supply.
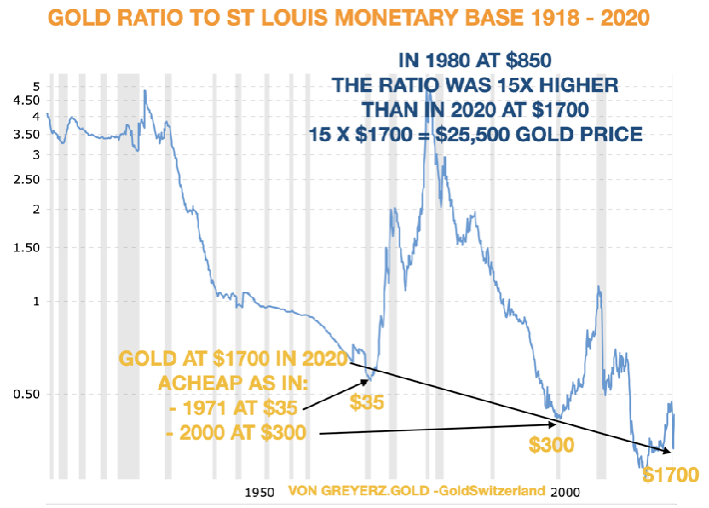
At this point we do not have an updated chart but it is our estimate that the monetary base has probably kept pace with the gold price meaning that the level in 2024 is similar to 2020.
So let me repeat my mantra:
Please jump on the Gold Wagon while there is still time to preserve your wealth.
The coming surge in gold demand cannot be met by more gold because more than the current 3000 tonnes of gold per annum cannot be mined.
THUS THE ONLY MEANS TO SATISFY THE COMING GOLD MANIA IS THROUGH MUCH HIGHER PRICES.

GOLD AND SILVER ENTERING EXPONENTIAL PHASE
It’s almost comical to watch policy makers of all stripes and country codes caught in a corner yet pretending we don’t notice.
Children In Charge
I’m reminded of the kid with his hand in the cookie jar while pretending his parents can’t see him—denying his guilt despite the crumbs falling from his face.
Again: It’s almost comical.
But there’s really nothing funny at all about major economies crawling into recession (Germany, Japan, UK, China) or denying recession (USA) while our mental midgets from DC to the EU play with bonds, inflation currency and war like kindergarteners with gas and matches.
Can’t Hide the Debt Cookie Crumbs
Speaking of kids caught with crumbs on their face while denying responsibility, it seems that even our central bankers can’t keep hiding the facts of now “unsustainable debt” (Powell) with clever lies, such as they had tried to do in the past:
In short, the days of hiding bad math behind empty words are now coming to an end, as most recently evidenced by another comical treasury market auction (below).
Keep It Simple: Debt & Bonds
As we’ve repeated ad nauseum, “the bond market is the thing,” and its survival, like a diesel V8 engine, lives and dies on liquidity/grease—i.e. dollars.
After trillions in outright grotesque QE grease following the bond crisis of 2020 and a hidden TBTF bank bailout (disguised as pandemic relief), the combined efforts of the Fed and Treasury Dept (i.e., the yin and yang of Powell and Yellen) to provide backdoor liquidity to this thirsty market are both tragic and remarkable.
Despite Powell’s headline tightening since 2022, the level of direct Fed liquidity is still tens of billions per month, and the hundreds of billions provisionally drawn from the reverse repo markets, the Treasury General Account (TGA), the Bank Term Funding Program (BTFP) are just QE by another pathway.
In addition to these tricks, tack on Yellen’s desperate attempt to issue trillions from the short end of the yield curve to take supply (and price) pressure off the sacred U.S. 10-Year, we can trace more examples of open desperation and backdoor liquidity by another name.
But at some point, all these liquidity tricks (as well as liquidity) run dry.
And when this “grease” runs out, that is when the bond engine stalls and the global financial system, led by a broke(n) U.S.A, starts its slow stall to the side of the proverbial road as the engine hisses, coughs and then dies.
Stated otherwise, the kids in DC are running out of cookies and jars (i.e., liquidity), and their lies and excuses are getting harder to hide.
Don’t believe it? Just look at the unloved US bond market.
A Very Telling & Embarrassing Treasury Auction
Having issued too many IOU’s (T-Bills) from the short end of the yield curve, Yellen’s Treasury Dept recently tried to auction off some IOUs from the longer end, namely the US 20Y UST.
Folks: It was embarrassing.
Foreign bidders for Uncle Sam’s 20-Year bond dropped to under 60% (they were 74% of the bidders in November).
This means that primary dealers (i.e., big banks) were forced to fill the gap by purchasing almost 22% of Uncle Sam’s increasingly unloved bar-tab of 20Y IOUs…
In simple speak, this is an open sign that the bond market is cracking. In fact, however, it has been cracking for a while…
Memories are short, as many have already forgotten the extreme dysfunction on the short end of the curve in Q1 of 2023 (not to mention the bank failures that followed, and with more to come, as warned…).
A similar disfunction is now openly obvious on the long-end of the bond curve, at least for those paying attention.
When bonds are unloved, their prices begin to fall, and their yields, which move inversely to price, start to rise, which means their interest rates rise too—adding more pressure (and cost) on Uncle Sam’s ability to repay the same.
Fiscal Dominance—More Than Just a Term of Art
This moment of interest expense “uh-oh” for DC is what the St. Louis Fed described in June of last year as “Fiscal Dominance,” namely that point where rising rates (and debt costs) get so high (i.e., dysfunctional), that the only option (and source) for more “greasy liquidity” (i.e., USDs) to support those ugly bonds is with money “clicked” out of thin air.
In short: More QE to the moon is inevitable, not debatable.
This QE inevitability is inherently inflationary, and this by the way, is the end-game for the Dis-United States, even if we experience a dis-inflationary recession somewhere in the middle of this tragic playing field.
Dollar Debasement—Right Before Our Eyes
Needless to say, such fake liquidity in the from an increasingly weaponized (and hence unloved) USD, places even more negative pressure on a DXY, which at the time of the aforementioned (and embarrassing) auction, was at 104, down from its 110+ levels of Q3 2022…
In the last four years of increasing bond dysfunction in the wake of drying liquidity, DC has shown five times in a row that it will come quickly and aggressively to the rescue to provide more fake grease (again, from the TGA, the BTFP, the repo markets etc.) to “save” the bond market at the expense of the currency.
Soon, we’ll just see plain ol’ QE, which will debase the USD even more, regardless of its “relative strength” to other equally, if not more, debased global currencies.
Such currency debasement, again, fits the pattern of all nations slowly dying from their own debt sins.
For now, of course, the markets are expecting Powell’s promised rate cuts to become actual rate cuts.
As a result, these markets are just giddy in anticipation and have recently hit all-time-highs on Powell words rather than Fed actions.
These already dangerously bloated markets will rise even further whenever the Fed has no choice but to hit the QE red button at the Eccles Building.
Tread Carefully You Top-Chasers
For those few, very few, who know how to trade nose-bleed tops without getting burned when net-incomes/margins trend south, the speculation and momentum trade juices are flowing.
But as I recently warned with evidence rather than hyperbole, today’s S&P, which is little more than a glorified tech ETF lead by 5 names, is the most dangerous bubble I’ve ever seen, traded or studied.
That Clever Pet Rock
Gold, meanwhile, will clearly get, and is already getting, the last laugh as stock bubbles inflate and bond markets scream for more debased USD grease.
The recent 20Y bond auction, above, with its foretelling of rising yields, should have been a massive headwind for that “yield-less pet rock.”
But as I argued from Vancouver in January, gold is breaking away from the standard correlations to rate, currency and inflation/deflation indicators.
Why?
For the simple reason that the overall system is now so openly broken, cracked, and dis-trusted that gold’s historically trusted (as well as speculator-ignored) role as a provider of real value (and 52-week highs) in world of diluted yet inflated currencies and bubble assets is becoming more obvious.
Again, this easily explains why central banks are stacking (and TRUSTING) this pet rock and dumping Uncle Sam’s IOUs at record levels.
That is, the world’s central banks (and leaders) see a US Humpty Dumpty about to fall off a wall, and when it does, gold will do far more to protect investors and sovereigns than bad IOUs and bubble assets measured in paper “money.”
Not surprisingly, the 0.5% of global financial assets allocated to gold are and will be rewarded not because they are just “contrarian for contrarian’s sake,” but because this remarkably small/informed minority are wise enough to think ahead rather just follow the sell-side sirens (and the crowd).
Which Needle Will Pop the Red Debt Ballon?
For now, and in the surreal backdrop of spiking markets and a Main Street on its knees and waiting for the “wealth effect” of a feudalistic rather that capitalistic financial system, all we can do is stare at the greatest debt bubble in history and guestimate which needle will “pop” it…
Will it be spiking rates colliding with the white swan of unprecedented global debt? A derivative market implosion? A geopolitical black swan? Another war? A collapsing Japan? China? America? A fractured/fragile EU? An immigration-lead fracturing of social order?
Who knows.
With so many needles pointed at a now historically unfathomable (and mathematically unpayable) red debt balloon, the actual needle that pricks us is rarely the one we see coming…
A Bank Needle?
As in 2008, the next crisis may come from where most crises are born, namely behind the glass doors of our stupid (and system-protected) banks…
The commercial real estate (CRE) crisis, of which I warned as far back as 2020, is anything but a minor matter.
The CRE losses on non-performing loans (NPLs) now exceeds the loss reserves at many of the largest US banks (Citi, Goldman, Wells, Morgan Stanley, JP Morgan etc.)
The Fed’s Real Mandate
Ironically, however, I don’t worry about these silly banks, because their Rich Uncle Fed’s real mandate is not inflation and employment, but making sure the foregoing banks, from which the Fed was un-naturally spawned, do not fail.
Bank regulators, who are just former bank executives, will meet FOMC and Treasury “experts” in DC and paste-together more back-room extend and pretend programs (which is how all failed banks deal with their failing loans and leadership) to provide the bigger boys with needed “grease” (i.e., liquidity) to stay alive (via forced yet subsidized UST, MBS and syndicated CRE/ABS purchases) as the Fed, once again, decides between saving the banking system or the currency.
Needless to stay, the suspense is hardly killing any of us who know how DC and Wall Street work.
In other words, expect more mouse-clicked trillions to save Uncle Fed’s spoiled banking nephews in a NYC which has slowly become not only a den of thieves, but a half-way house for millions of illegals which we like to call “asylum seekers” …
Ah, the American Dream, ah, the city that never sleeps…and the nightmare that never ends for every inflation-braced Main Street from Sea to Shining Sea.
Big Trouble in Little China
Of course, the US is not alone with yet another real estate cancer. China’s CRE crisis is arguably and mathematically worse.
But is that any real consolation to those facing an increasingly debased Greenback and unloved UST?
Are we supposed to be happy that our currency and bonds, though awful, are still better (for now, at least) than China’s?
Well, if our Dollar and IOU are so relatively special, why are the yields on our 10Y UST spiking 200 basis points above the CGB (Chinese Government Bond) yields?
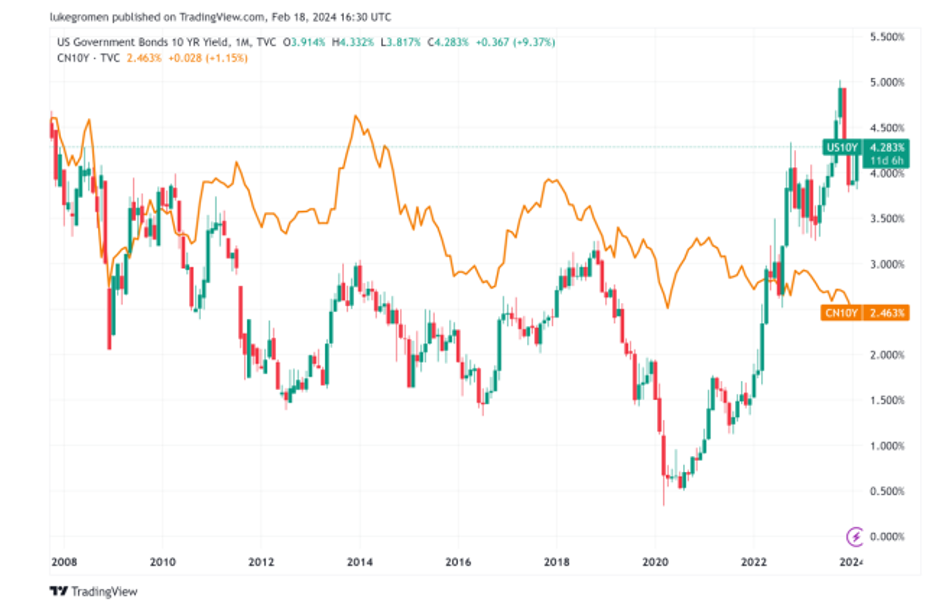
Well, unlike the US, China is not pretending to be above total control over its markets and people, a trend which will come to the West once its childish leaders are forced into a debt corner.
History’s Sad Pattern
As I’ve warned for years, the syllogism from debt-crisis to market-crisis to currency and inflation crisis, followed by social unrest and then increased centralization from the extreme left or right is a pattern as old as history itself.
China has no shame about overt capital controls or state-owned banking.
But are our Fed-supported TBTF banks any less “centralized” just because their CEO’s get paid like capitalists despite being bailed out like state-sponsored entities?
We have had Wall Street socialism for years, but have put a nice “free market” lipstick on what is in essence just an “insider” pig.
Based on the trends above, and the pattern just described, the slow-drip toward more currency debasement, inflation and centralized (and capital) controls (think CBDC) in the wake of social unrest (from truckers and tractors fighting their “lords” from NYC to Berlin) is not only here and now, but the tragic road ahead.
This pattern of centralization, sadly, is just history and math. The cycles will play out. And gold, though no cure-all for all the overt and covert sins of our failed leadership, will at least be a cure for our failed currency.
GOLD AND SILVER ENTERING EXPONENTIAL PHASE
In this critically important Gold Matters discussion, VON GREYERZ principals, Egon von Greyerz and Matthew Piepenburg, place the enormous risks of the current U.S. equity bubble within the much-needed context of unprecedented global economic factors.
Egon opens the discussion with a brief review of the unprecedented string-cite of global geopolitical, social, economic and debt risks. From a preventable and escalating land war in the Ukraine to conflicts in Gaza and the broader Arab world to nose-bleed global debt levels in the backdrop of now undeniable social tensions and de-dollarization, the need to be realistic rather than just “negative” is of common-sense importance. As we head into a year already marked by such massive fissures, any attempt to gloss over these facts with an S&P making record highs would be missing the forest for the trees. In fact, the current U.S. bubble is far more of a dangerous rather than safe indicator when placed into needed context.
Toward this end, Matt speaks to something all-too familiar, having managed a hedge fund as well as a family office during prior asset bubbles. Matt gives particular attention to the overt risk indicators of the current S&P bubble, which teeters on the twin edge of unprecedented concentration and over-valuation metrics.
Matt’s perspective is not theoretical, but hands-on, as he explains how the current asset bubble, like the dot.com bubble of 2000, is in fact driven by the same fundamentals. He compares the Magnificent 7 to equally profitable and “good” names like the Microsoft, Cisco and Qualcomm of 1999-2000, noting that such otherwise profitable companies rising on margin growth eventually experience inevitable contraction in net income once price, volume and cost advantages trend negatively. No one, of course, can time such shifts, but “this time is NOT different,” as all such bubbles end the same: They pop.
What makes the current bubble (AI mania) so much more dangerous, however, is that it is led by 5-7 names, and when they mean-revert, as all over-valued companies do, there’s nothing left to prop the S&P. In short, when these names fall, everything falls with it, and this time around, the entire global economy is already on its knees. This is bad.
Egon closes the conversation with his own, and equally hands-on, perspective of investing through asset cycles and bubbles, offering needed insights on the risks, as well as lessons, of prior manias. Naturally, the conversation turns to real money and real assets, namely the far less “maniacal” gold. As the foregoing risks continue their exponential growth, gold rewards the far-sighted investor in obvious ways not otherwise understood by speculators. Matt, though not averse to the speculative mind-set, warns of the seductive appeal of chasing (and buying tops) and makes an equally straightforward case for gold in a world losing perspective.